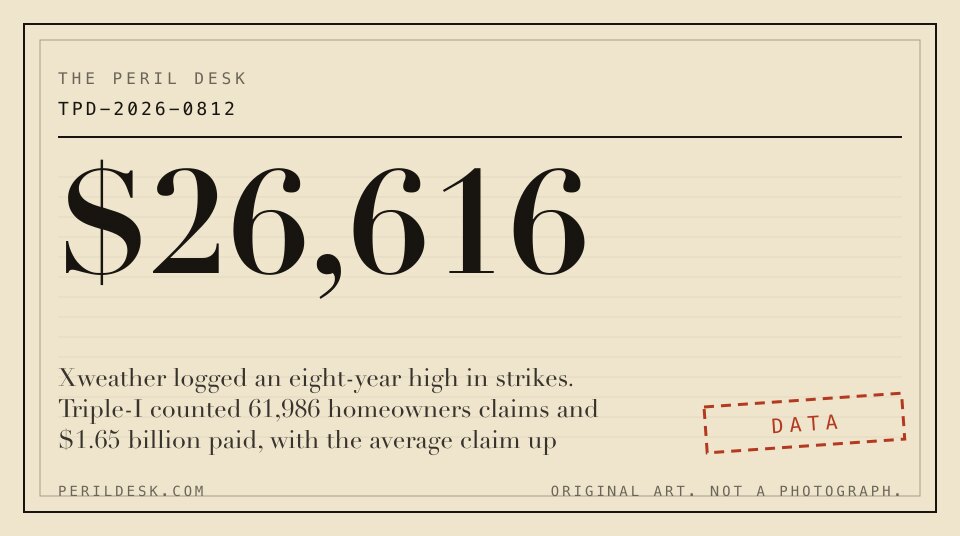
The Xweather Lightning Network counted 251,800,297 lightning events over the continental United States in 2025. That is an eight-year high and a 20 percent jump on 2024. Over the same twelve months American insurers paid an estimated $1.65 billion on 61,986 homeowners insurance claims for lightning damage, and the average paid claim came to $26,616.
Eight years earlier the average was $10,781.
Lightning did not become 43 percent more destructive between 2024 and 2025. What changed sits inside the house. The Insurance Information Institute’s own chart of covered perils lists lightning first and covers it on every homeowners form sold. It lists electrical surge damage sixteenth, with a parenthetical that names the exact component most likely to die.
Then the same storm got more expensive.
The claim figures come from Triple-I, released June 18, 2026, covering calendar year 2025 and built on claims data supplied by State Farm. State Farm is the largest writer of homeowners insurance in the country, with direct premiums written of $31.46 billion in 2024, which is why its book is the one the industry estimate is built from.
Frequency moved a little. Severity moved a lot. The number of lightning claims rose 11.6 percent, from 55,537 to 61,986. Total payouts rose 59 percent, from $1.04 billion to $1.65 billion. The average cost per claim rose 42.8 percent to $26,616, a 146.9 percent increase over the 2017 average.
“The sharp increase in average claim costs reflects broader trends affecting homeowners across the country, including rising reconstruction costs, inflation, the growing value of property and technology inside the home, as well as litigation abuse,” said Sean Kevelighan, chief executive of Triple-I.
The nine-year series is worth reading in full, because the headline number is not the record most coverage implied it was.
| Year | Value of claims | Number of claims | Average cost per claim |
|---|---|---|---|
| 2017 | $916.61 million | 85,020 | $10,781 |
| 2018 | $908.93 million | 77,898 | $11,668 |
| 2019 | $920.05 million | 76,860 | $11,971 |
| 2020 | $2,066.74 million | 71,551 | $28,885 |
| 2021 | $1,313.06 million | 60,851 | $21,578 |
| 2022 | $950.22 million | 62,189 | $15,280 |
| 2023 | $1,239.72 million | 70,787 | $17,513 |
| 2024 | $1,035.28 million | 55,537 | $18,641 |
| 2025 | $1.65 billion | 61,986 | $26,616 |
Data last updated . Source: Triple-I estimates built on State Farm claims data, released June 18, 2026 for calendar year 2025. Download this table as CSV.
2020 beat it. That year insurers paid $2.07 billion on 71,551 claims, an average of $28,885 per claim. So 2025 is the most expensive lightning year since 2020 by total payout, and the second most expensive per claim in the nine years Triple-I has published on this basis. Nobody who filed in 2020 got a press release about it.
The claim count is the other half of the reversal. It had fallen for most of a decade, from 85,020 in 2017 down to 55,537 in 2024, which Triple-I called the lowest number of claims since before 2017. “Fewer claims and a decline in severity indicate increased awareness, and improved mitigation,” Kevelighan said in the release announcing that low. The next year put 6,449 claims back on the board and roughly $610 million with them.
Texas beat Florida and Oklahoma combined.
Where the strikes land and where the money goes are two different maps, and Texas sits at the top of both.
| Rank | State | Lightning events detected in 2025 |
|---|---|---|
| 1 | Texas | 47,361,143 |
| 2 | Florida | 20,034,067 |
| 3 | Oklahoma | 17,658,353 |
| 4 | Louisiana | 12,624,227 |
| 5 | Arkansas | 12,229,238 |
Data last updated . Source: Lightning detection counts for 2025 as cited on the page. Download this table as CSV.
Texas logged more lightning than Florida and Oklahoma put together. It also produced the highest total insured lightning losses of any state in the 2025 claim data, close to $253 million, and the highest average cost per claim among the leading states at $60,382. That average is more than double the national figure.
Florida filed the most claims, 5,167, with California second and Texas third. More than half of all lightning claims in 2025 came from the ten states with the highest claim volumes. Florida also carries the heaviest lightning density in the country at 305 events per square mile.
The single most electrified place in the United States last year was Shady Grove, Oklahoma, which absorbed 1,160 lightning events per square kilometre. The busiest day was April 5, when the network logged 3,099,808 events in twenty-four hours, weeks ahead of the May to September season. Over half of all lightning in the country lands in seven states.
The claim map does not copy the strike map. Triple-I’s most recent published state table covers 2024, and its top five by number of claims read Florida 4,780, Texas 4,369, California 4,005, Georgia 3,376 and North Carolina 2,574. California ranked 35th in the country for lightning in 2025, with 742,771 events, roughly 1.6 percent of Texas. It ranked third in the country for lightning insurance claims. Oklahoma ranked third for lightning and does not appear anywhere in that top ten for claims.
Strikes decide where the events happen. Houses, their contents, and how many of them carry a policy decide where the claims happen. In 2024 the same peril produced an average claim of $23,686 in Florida and $38,558 in Texas.
The odds this file will not print.
There is exactly one published lightning odds ratio in American public data, and the National Weather Service prints its denominator right next to it. Based on averages for 2009 through 2018, against an estimated United States population of 330,000,000 as of 2019, and counting 27 reported deaths plus 243 estimated injuries in a typical year, the NWS puts the odds of being struck in a given year at 1 in 1,222,000. Over an estimated 80-year lifetime it puts them at 1 in 15,300. It prints a third line as well: at roughly ten people affected for every one person struck, the odds you are affected by someone else’s strike run 1 in 1,530.
Those are personal-injury odds. They cover human bodies over a stated decade against a stated population. They say nothing about a roof.
Triple-I publishes no per-household odds of a lightning claim, and this file will not manufacture one. Dividing 61,986 claims by a count of American housing units would produce a ratio neither organisation computed. The numerator is an industry estimate scaled from one insurer’s claims data. The denominator would include millions of homes carrying no policy at all. Two honest numbers, one dishonest fraction.
Ninety percent of them lived.
Twenty-one people were killed by lightning in the United States in 2025, up from 14 in 2024, against a ten-year average of 20. Through August 12, 2026, the count stands at four. The tallies come from the National Lightning Safety Council by way of the National Weather Service, which marks them preliminary.
The long trend runs the other way. Across 1989 to 2018 the country averaged 43 reported lightning deaths a year. Across 2009 to 2018 the average fell to 27. The NWS states the survival arithmetic plainly: “Only about 10% of people who are struck by lightning are killed, leaving 90% with various degrees of disability.”
The deaths cluster hard. On the ten-year monthly averages the NWS publishes for 2016 through 2025, July carries 6 of the 20 annual deaths, June and August carry 4 each, and the months from October through March carry a rounded zero between them. The gender split is not close either. Of the 200 lightning deaths logged from 2016 through mid-2026, 163 were male and 37 were female.
Then the surge went down the wire.
Item 1 on Triple-I’s chart of covered perils reads “Fire or lightning.” It carries a mark in every column, HO-1 through HO-8. Lightning is a named peril on every homeowners form the chart lists, which is why a strike that burns a house is one of the least disputed claims in property insurance.
Item 16 is where the electronics live. It reads “Sudden and accidental damage from artificially generated electrical current (does not include loss to a tube, transistor or similar electronic component).” The parenthetical names the exact part that fails. Item 16 is also absent from two of the forms on the chart, HO-1 and HO-8.
“Lightning remains a costly and unpredictable threat, with ground surges causing nearly half of all claims,” said Michal Brower of State Farm. “These events can cause extensive damage to electrical systems, appliances and even structural issues.”
Half the claims, by the insurer’s own account, arrive as surge rather than as a hole in the roof. Triple-I’s consumer page on lightning coverage hedges that half in five words: “Some policies also provide coverage for the damage caused by power surges.” The word carrying the weight is “some.”
The 2025 release put a name to the growing side of the bill. “Power surges generated by lightning can damage electrical systems, appliances, computers and smart-home technologies,” said Dave Phillips of State Farm. Every one of those has a tube, a transistor, or a similar electronic component inside it, and the value of that inventory per household is what moved 42.8 percent in one year.
The average paid lightning claim was $10,781 in 2017 and $26,616 in 2025. Same peril, same line one on the chart, 146.9 percent apart.